Reaching 100 million users in just five days of launch, Meta’s Threads app is attracting users with its simple integration with Meta apps and profile setup. As with any social media network, you must take a strategic approach when building your presence. That’s where understanding Threads analytics plays a vital role.
When you know what posts resonate, whether it’s long-form text posts or image posts, you can create a data-driven content strategy for the app. This is where your Threads metrics help you uncover key insights.
In this guide, we’ll walk through Meta Threads analytics, from how to access the dashboard to making sense of the data.
Key Meta Threads metrics and analytics to track
Threads give you access to several important performance insights—not just on your content but that of other users. This is especially useful for social media competitive analysis. Here are some key Threads metrics to track in your analytics dashboard (also called Threads Insights).
Reach and impression metrics
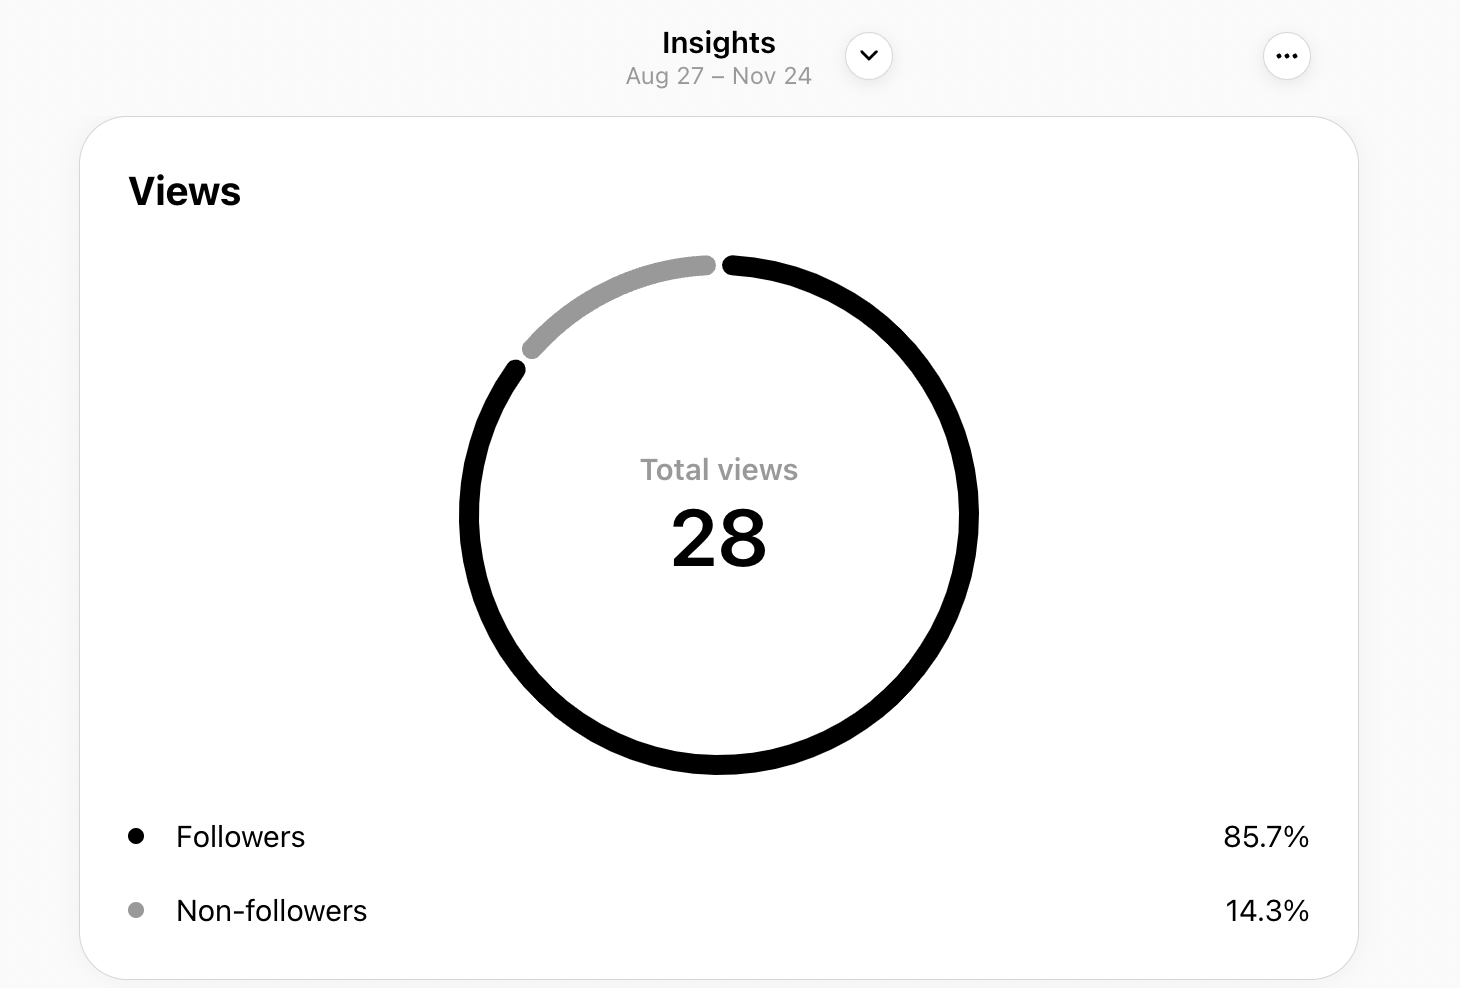
Views has now replaced plays and impressions from the Threads analytics dashboard. The Views in your dashboard shows you the number of profile views by followers and non-followers. This gives you an idea of how often your profile is showing up in people’s Feeds.
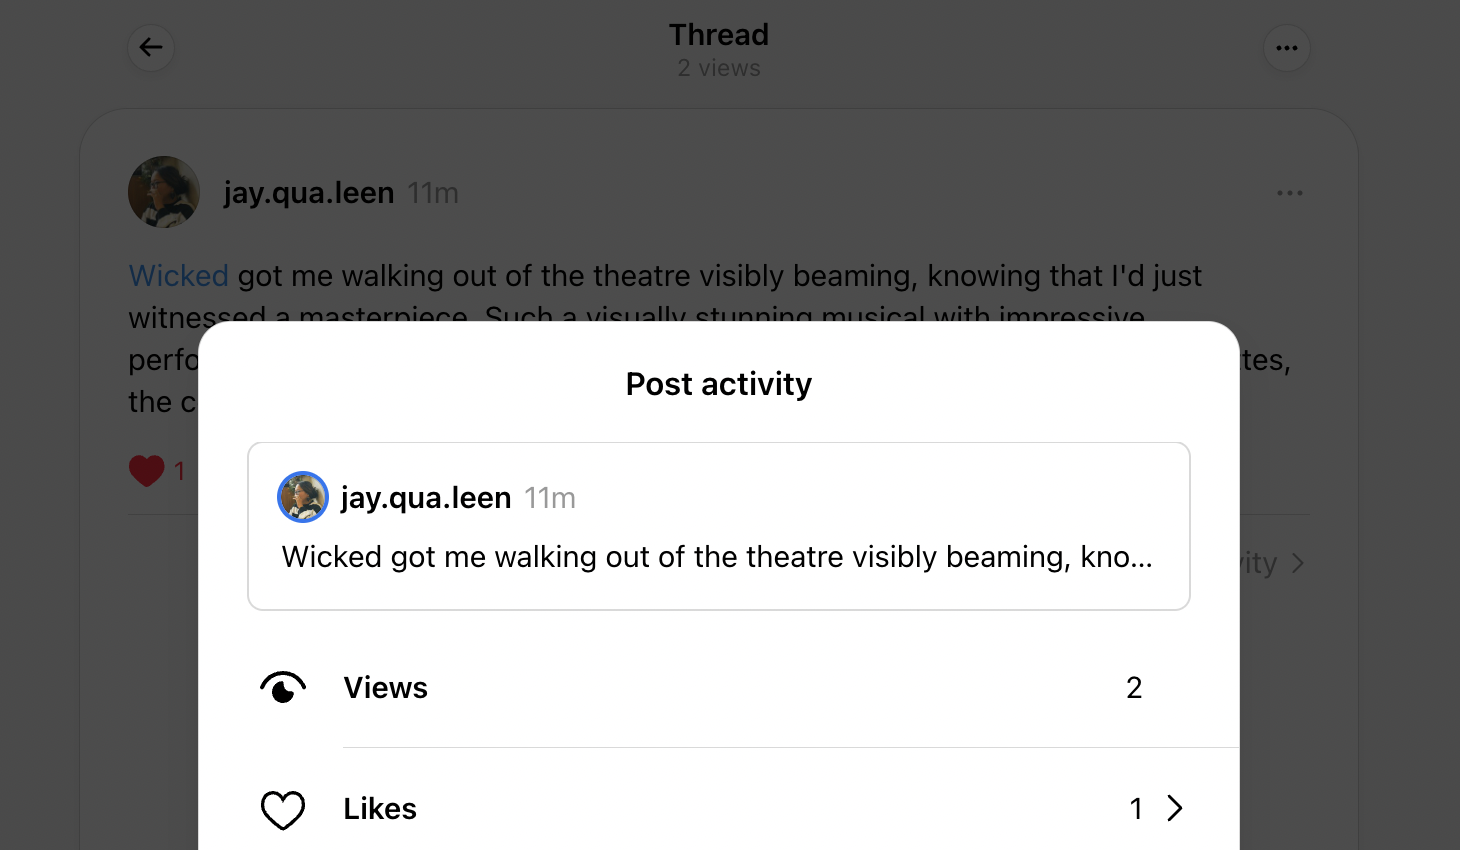
Threads also shows you the number of views for individual posts when you click on View activity under each post. This helps you understand how your posts are reaching people on the platform.
The best part is you also get to see these metrics for other people’s posts, if they haven’t hidden their like and share counts.
Engagement metrics
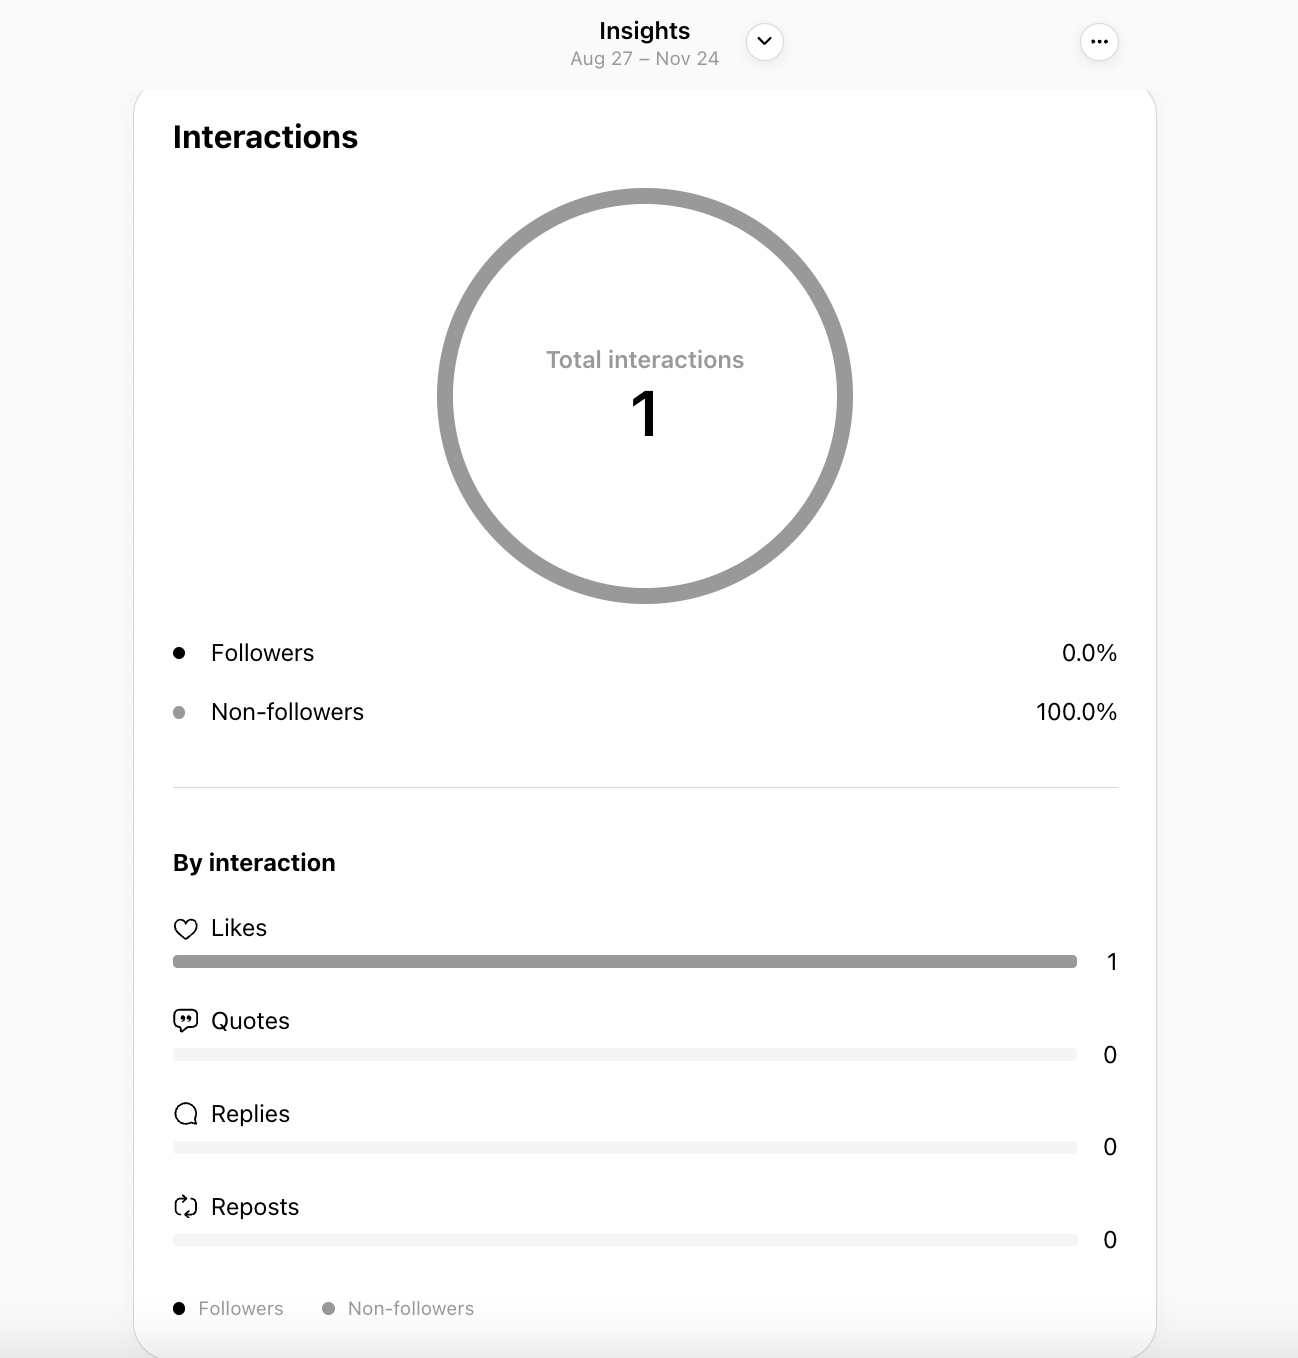
Interactions in your Threads dashboard shows you the total number of times people have engaged with your content over a given period. Here, you see a breakdown of different interaction types, such as likes, quotes, replies and reposts. Again, you can view these interactions by both followers and non-followers.
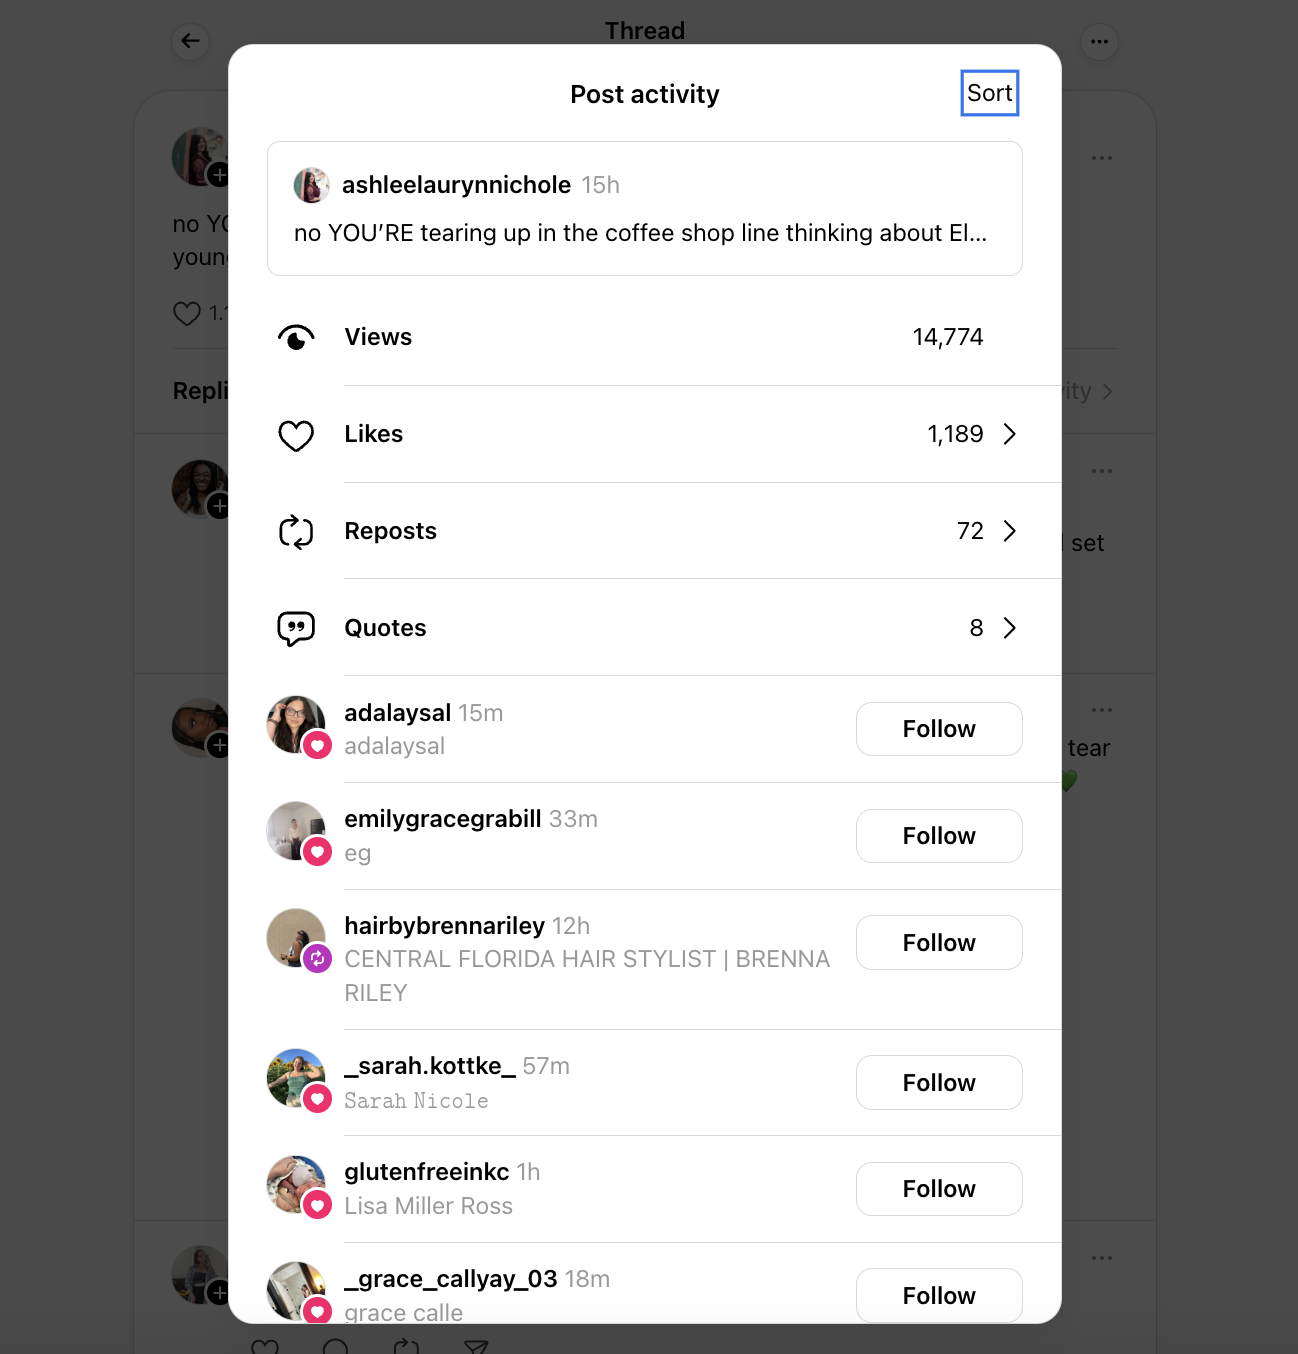
To get post-specific interaction reports, click on View activity under the post. This will show you the number of likes, reposts and quotes for each post. Use these insights to see how specific posts drive engagement.
Similar to view counts, you can view engagement metrics for posts from other Threads users. Use this feature to see what the top brands on Threads are doing. Which of their posts are driving engagement? What do their top-performing posts have in common?
Source: Threads
Follower growth metrics
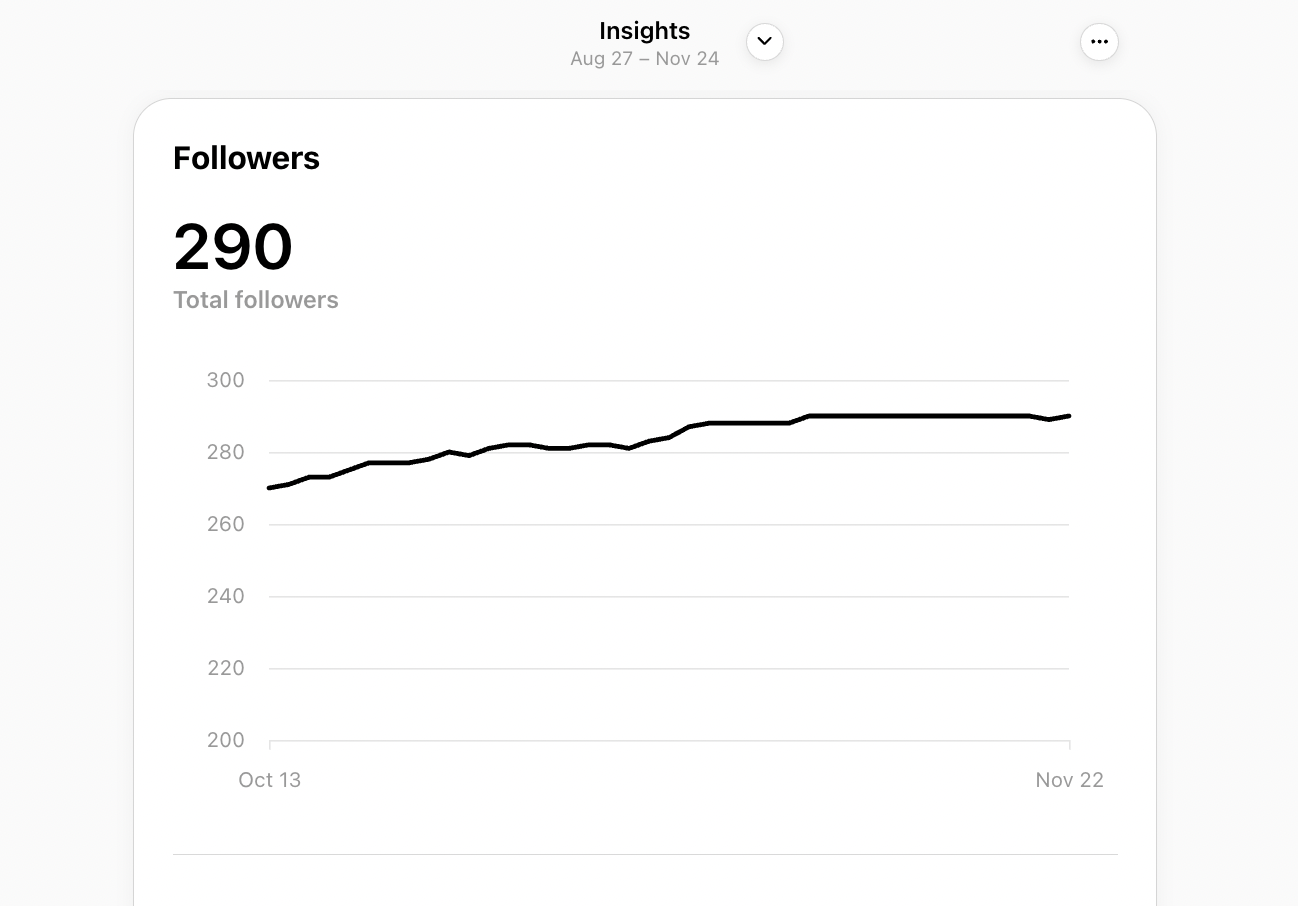
The Followers section in your dashboard shows you a chart of your total followers over time. This helps you visualize how your account has grown over a period. You ideally want to see a steady rise in the chart. Any dips could indicate a need to step up your social media marketing strategy for Threads.
Audience demographics
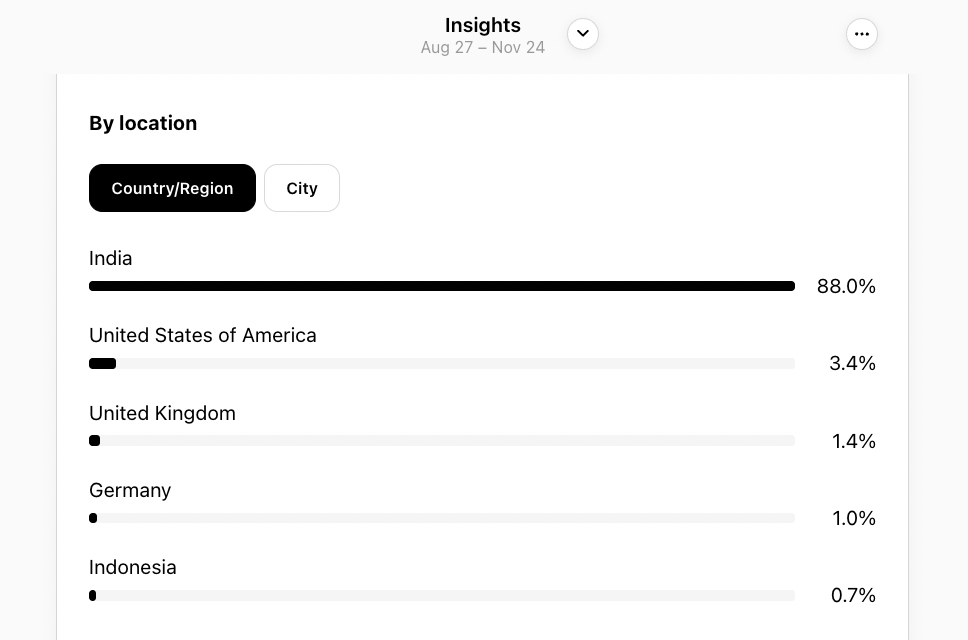
Scroll down for a more detailed breakdown of your audience demographics. You can see the audience distribution across countries, regions and even specific cities. This helps you understand how to adapt your strategy to better resonate with people based on their locations.
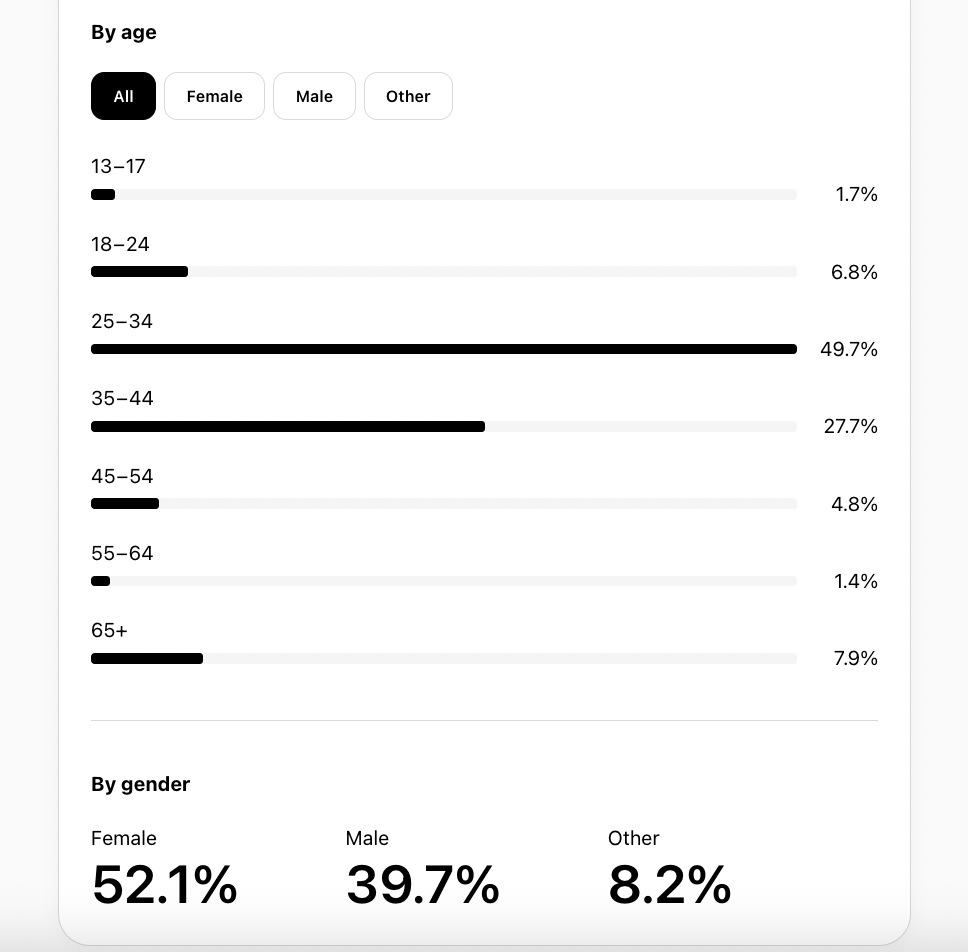
The Threads dashboard also shows you a detailed audience breakdown based on age and gender. Threads is unique in that its gender reporting goes beyond male and female. Unlike most platforms, it includes reporting for other genders for followers whose gender identity doesn’t fit the male and female binary.
Navigating to the Threads analytics dashboard
Meta introduced Threads Insights for desktop in August 2024. The good news is the analytics dashboard is accessible to all users, even if they don’t have a creator or business account. The only caveat is that you must have at least 100 followers to use this feature.
Here’s how to see Threads analytics on the web app:
- Click the More button at the bottom left-hand panel of the screen.
- Select Insights from the menu to open your analytics dashboard.
![two windows-one showing a red arrow pointing to the "more" button on Threads desktop app and another with a red arrow pointing to the "Insights" option from the menu]()
- By default, Threads will show you insights for the last 30 days. Click the Insights drop-down menu at the top of the page. Then select the time frame for which you want to track your Threads metrics—last seven, 14, 30 or 90 days. At the time of writing this post, there’s no option to track metrics for a custom timeframe.
![Threads Insights page with drop-down menu showing the option to choose between the last 7 days, last 14 days, last 30 days and last 90 days]()
- Scroll down to see your views, interactions, follower growth and audience analytics, respectively.
Insights for the Threads mobile app started rolling out in October 2024. Here’s how to see Threads analytics on mobile:
- Go to your profile page on the Threads mobile app.
- Tap on the Insights icon at the top right-hand side of the screen.
- This will open up your Threads analytics dashboard, providing the same insights as you see on desktop.

Uncover Meta Threads analytics with Sprout Social
Sprout Social’s Threads integration offers powerful analytics to track your content performance to gain a holistic view of your social performance. All users can track their Threads metrics in their Post Performance Report, and Premium Analytics users with access to My Reports can add Threads performance widgets into custom My Reports to gain additional insights.
With Sprout, you can effortlessly track metrics, including impressions, engagements, reactions and shares, all within the Post Performance Report. Compare your Threads content against your other social content. Are your posts getting more views on Threads vs. X? Are certain types of content seeing notably higher engagement on Threads vs. Instagram? This helps you understand what to post on each social media platform, including Threads.
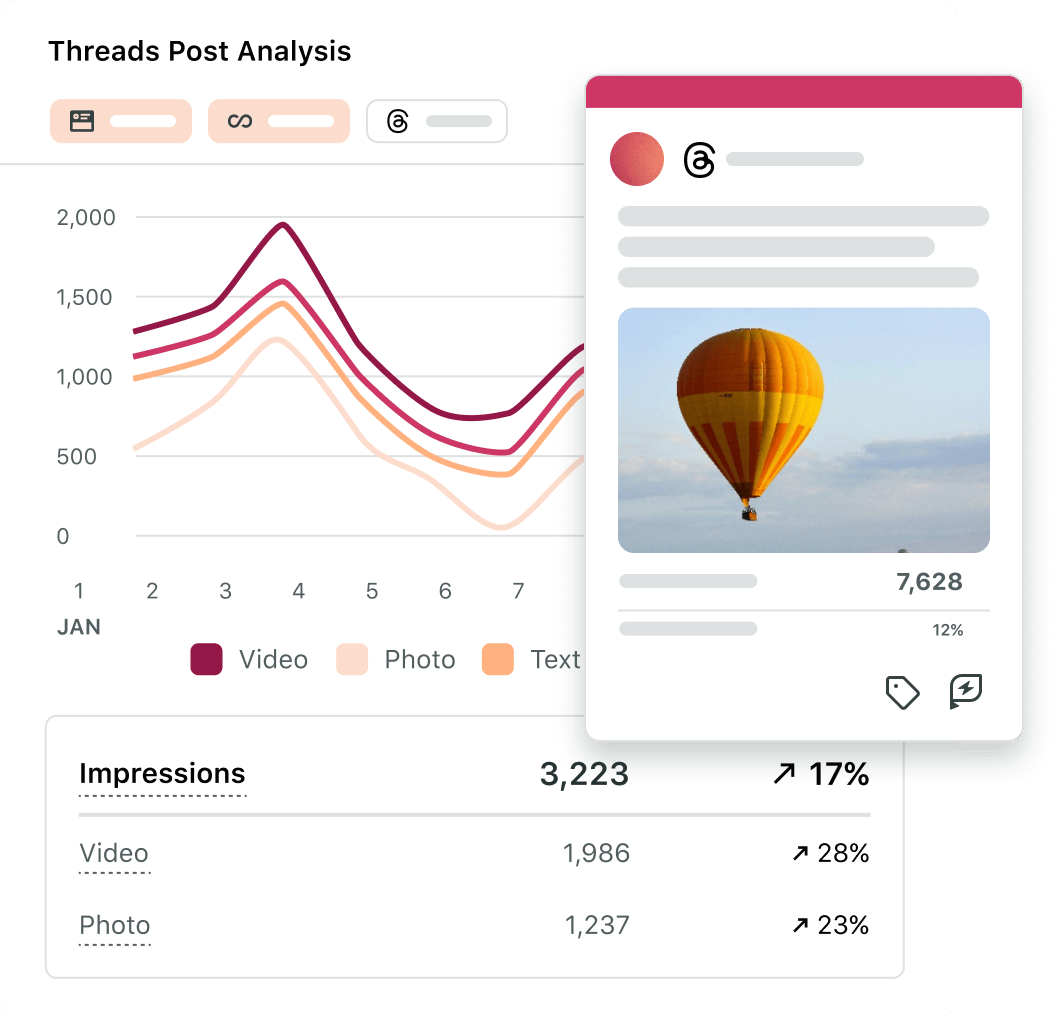
The Post Performance Report takes the load off your plate and puts all your post-specific insights in one place.
Go beyond basic metrics and dive deeper into your Threads performance with Sprout’s advanced analytics. Post-level insights on Sprout are much more comprehensive than native post analytics, including impressions (views), engagement rate per impression, overall engagements, likes, replies and shares. Premium Analytics users can uncover more valuable insights into what resonates with your audience:
- Engagements
- Engagement rate per impression
- Publish posts
Tips for using Threads metrics for content optimization
Understanding your Threads metrics will help you build a data-backed strategy to grow your presence on the platform. Let’s look at a few tips to better use data from your Threads analytics.
Analyzing performance trends over time
Profile-level insights on Threads help you understand how your account has performed over time. In particular, the follower growth chart lets you visualize patterns in your account’s growth.
Have you noticed an increase in followers during the given time frame? Has your growth stagnated recently? Use these insights to uncover performance trends. Then connect these trends to specific account activities and campaigns to see what’s working and what’s not.
Meanwhile, Sprout’s Post Performance Report helps you visualize how your posts have performed over time. This makes it easy to connect changes in your performance to specific posts and content strategies.
Identifying top-performing posts
On a related note, the Post Performance Report makes it easy to identify your top-performing posts. Connect patterns and adapt your social media content strategy accordingly. Are there any content formats that consistently see higher engagement? Do you get more visibility when you post anecdotes?
This is important because Threads prioritizes posts with the most engagements or views. So you can improve your visibility when you create posts similar to the ones that perform well on the platform.
Setting clear goals and objectives for Threads
The best way to leverage Threads analytics is by knowing exactly what to track. That way, you’re not wasting time on metrics that don’t really serve your social media goals.
When you have a clear idea of your goals, you can better align your analytics tracking with your overall marketing strategy. For example, if your goal is brand awareness, you may need a robust cross-platform strategy that uses Instagram Threads. Seeing how your posts are reaching and engaging non-followers and your account growth over time will help you measure this goal.
A/B testing different posting times and content formats
Consistent testing on social media helps you fine-tune your strategy and improve your performance. Similarly, perfecting your Threads strategy is all about regular A/B testing.
Just like on other social networks, visibility on Threads depends on getting that initial engagement. This means sending out your posts at a time when your audience is likely to see and engage with them.
Sprout’s ViralPost® technology uses AI to analyze historic engagement data to recommend times when your audience is likely to engage with your content. The Optimal Send Time feature then suggests the best time to publish your posts for optimum engagement.
Additionally, your A/B tests should also involve content formats. Threads allows you to be creative with text, image and video posts, so try repurposing content from your other campaigns on the app. Publish different content formats and use the Post Performance Report to see which ones see the highest views and engagement.
Maximizing success with Meta Threads analytics
With Threads being fairly new to the social media landscape, it boasts high engagement and rapid user growth. This creates the perfect conditions to build your presence on the platform. Closely monitor your Threads analytics to create campaigns and content that drive results.
Sprout’s Threads integration lets you view how different posts are performing in one place. This simplifies your analytics efforts, making it easy to identify patterns to drive success on the platform. Use our 2024 Content Strategy Report can help guide you in creating your Threads strategy as you begin to track metrics.
See how these features add value to your Threads strategy with a free 30-day trial.
The post Meta Threads analytics: A complete guide to measuring success appeared first on Sprout Social.

